


This article was published as a part of the Data Science Blogathon


Introduction:
Clustering is an unsupervised learning method whose job is to separate the population or data points into several groups, such that data points in a group are more similar to each other dissimilar to the data points of other groups. It is nothing but a collection of objects based on similarity and dissimilarity between them.
KMeans clustering is an Unsupervised Machine Learning algorithm that does the clustering task. In this method, the ‘n’ observations are grouped into ‘K’ clusters based on the distance. The algorithm tries to minimize the within-cluster variance(so that similar observations fall in the same cluster).
KMeans clustering requires all variables to be continuous as it uses the distance measure and prior specification of the number of clusters(K).
In this blog, we will learn:
- How does the KMeans algorithm work?
- The Distance Metrics
- How do we select the right K value?
- Properties of clusters
- Implementation of KMeans clustering in Python using sklearn library
How does the algorithm work?
In Hierarchical clustering methods, it is not required to specify K, but for KMeans we need to upfront specify the K.
- For a given value of K, initialize K number of centroids randomly and the data points are partitioned into K clusters
- compute the distance between each of the input to the K centroids and re-assign it to the cluster with the least distance
- after the re-assignment, update the centroid of each cluster by calculating the mean of the data points in the cluster
- repeat steps 2–3 until there is no re-assignment required

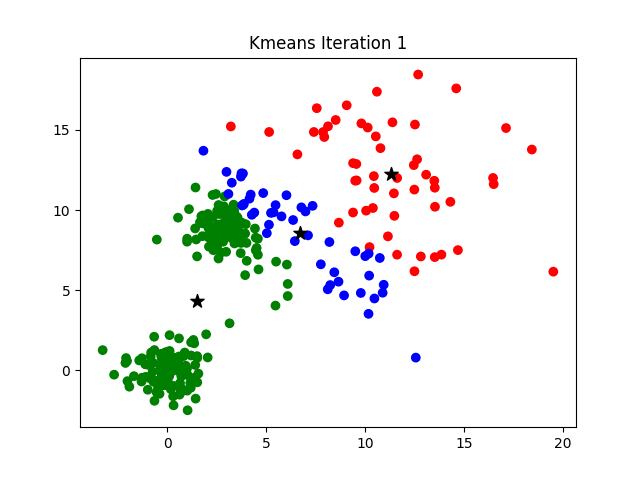
Visual representation of working of Algorithm(Source)
Distance Metrics
KMeans is a centroid/distance-based algorithm where the distance between each point is calculated and then assigns it to a cluster. The distance can be calculated using
- Euclidean Distance
- City block/Manhattan Distance

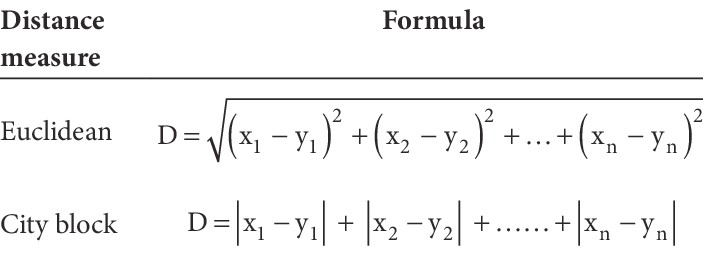
The formula for Euclidean and Manhattan distance measures
Properties of clusters
- All the data points in a cluster should be similar to each other(homogeneity). Within Cluster Sum of Squares(WCSS) is the total sum of the squared average distance of all the points within a cluster to its centroid. The lesser the better.
- Data points from different clusters should be heterogeneous. Between Clusters Sum of Squares (BCSS) is the total sum of the squared average distance between all centroids. A larger value indicates that clusters are spread out, while a smaller value indicates clusters are close to each other.
How do we select the right K value?
If we have two-dimensional data, we can visualize the data using a scatter plot and decide the number of clusters. But if we have multidimensional data, it is indeed difficult to visualize. Wrong k value might result in wrong or unstable clusters.
So we use a technique called Elbow Method to obtain an optimal K value.
In this method, we plot the WCSS values for a range of K.
Suppose, K=3, we will have three clusters whose Within Cluster Sum of Squares are WCSS1, WCSS2, WCSS3 respectively. Total WCSS is the sum of WCSS1, WCSS2, WCSS3.
WCSS = WCSS1 + WCSS2 + WCSS3
After calculating the WCSS plot it against different values of K. Look for an elbow shape in the graph to find the optimum K value.

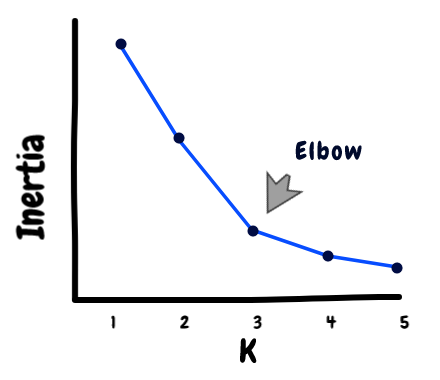
Elbow Curve Illustration
We can see a bend at K=4 in the above graph indicating 4 is the optimal number of clusters.
Implementation of KMeans clustering in Python using sklearn library
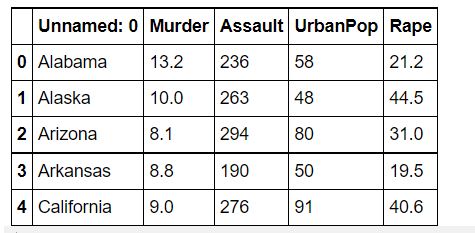
I will be taking the crime_data.csv dataset for our implementation.
About our dataset: It has five features — State, Murder, Assault, UrbanPop, Rape.
- Murder — Murder rates in different states of United States
- Assault — Assualt rate in different States of United States
- UrbanPop — urban population in different States of United States
- Rape — Rape rate in different States of United States
Let’s begin with importing necessary libraries
import pandas as pd
import NumPy as np
import matplotlib.pyplot as plt
from sklearn.cluster import KMeans
from sklearn.preprocessing import MinMaxScaler
Create pandas data frame from crime_data.csv
data = pd.read_csv("crime_data.csv")
data.head()

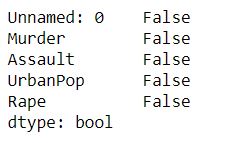
Check if there are any null values
data.isnull().any()

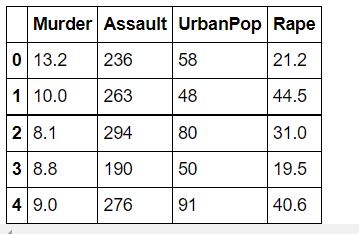
Dropping the categorical feature and copy the remaining data to another data frame
mydata = data.iloc[:, data.columns!=’Unnamed: 0']
mydata.head()

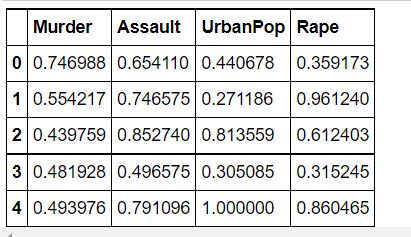
Scaling Data (used MinMaxScaler)
scaler = MinMaxScaler()
norm_mydata = mydata.copy()
def minmaxscaler(x):
    for columnName, columnData in x.iteritems():
        x[columnName] = scaler.fit_transform(np.array(columnData).reshape(-1, 1))

minmaxscaler(norm_mydata)
norm_mydata.head()

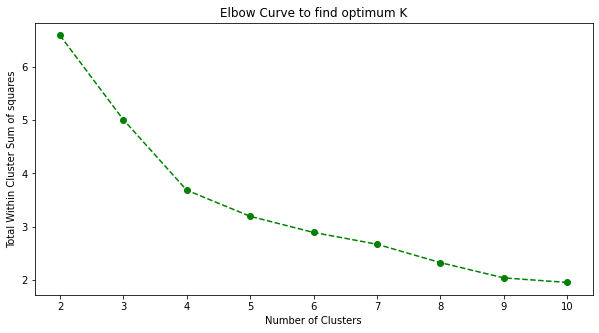
Scree plot or Elbow plot to find K
k = list(range(2,11))
sum_of_squared_distances = []
for i in k:
    kmeans = KMeans(n_clusters=i)
    kmeans.fit(norm_mydata)
    sum_of_squared_distances.append(kmeans.inertia_)

plt.figure(figsize=(10, 5))
plt.plot(k, sum_of_squared_distances, 'go--')
plt.xlabel('Number of Clusters')
plt.ylabel('Within Cluster Sum of squares')
plt.title('Elbow Curve to find optimum K')

Elbow Curve (Image by Author)
From the above figure, we find K=4 as the optimal value.
Building KMeans model with K=4 (Training and Predicting)
# Instantiating
kmeans4 = KMeans(n_clusters = 4)

# Training the model
kmeans4.fit(norm_mydata)

# predicting
y_pred = kmeans4.fit_predict(norm_mydata)
print(y_pred)

# Storing the y_pred values in a new column
data['Cluster'] = y_pred+1 #to start the cluster number from 1
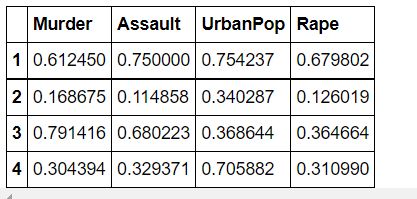
Storing the centroids to a data frame
centroids = kmeans4.cluster_centers_
centroids = pd.DataFrame(centroids, columns=['Murder', 'Assault', 'UrbanPop', 'Rape'])
centroids.index = np.arange(1, len(centroids)+1) # Start the index from 1
centroids

Sample visualization of clusters
Let’s just take any two of the features and plot to see how the observations are clustered.
import seaborn as sns
plt.figure(figsize=(12,6))
sns.set_palette("pastel")
sns.scatterplot(x=data['Murder'], y = data['Assault'], hue=data['Cluster'], palette='bright')

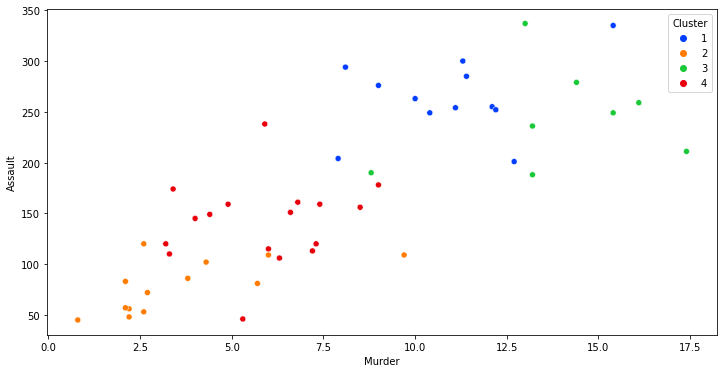
Visualization of Cluster
End Notes
In this blog, we’ve learned the working of the KMeans algorithm, different distance metrics used, and the Elbow curve method for finding the right K value. I hope you enjoyed reading this article, feel free to share it with your study buddies.
Check out my previous articles on KModes Clustering.
References
Elbow Method to find the K value
Scaling using sklearn MinMaxScaler
Other Blog Posts by me
Feel free to read my other blog posts from my Analytics Vidhya Profile.
You can find me on LinkedIn, Twitter just in case you would want to connect. I would be glad to connect with you.
For immediate exchange of thoughts, please write to me at harikabonthu96@gmail.com.
Happy Learning!
The media shown in this article are not owned by Analytics Vidhya and are used at the Author’s discretion.